Tag: Visualization
-
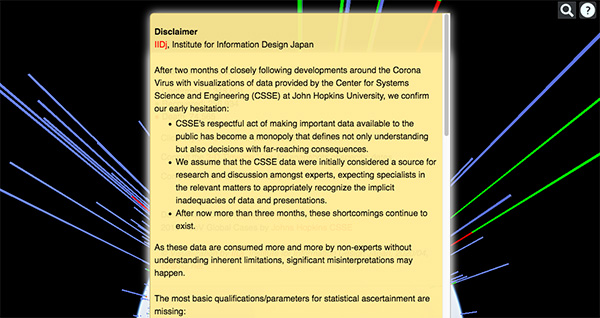
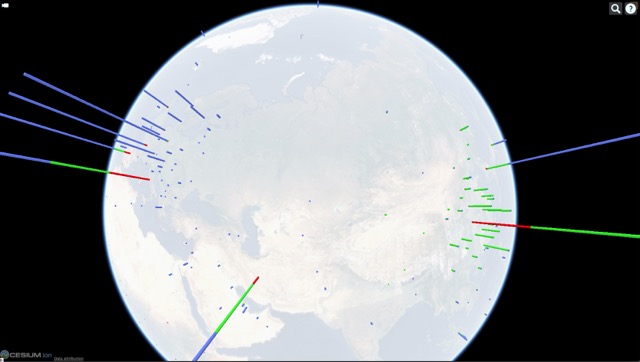
Comment on Corona data quality
Comment by Andreas Schneider, Institute for Information Design Japan, on the quality of data provided by the Center for Systems Science and Engineering (CSSE) at John Hopkins University, basis for the “Corona Navigator” featured in a previous post.
-
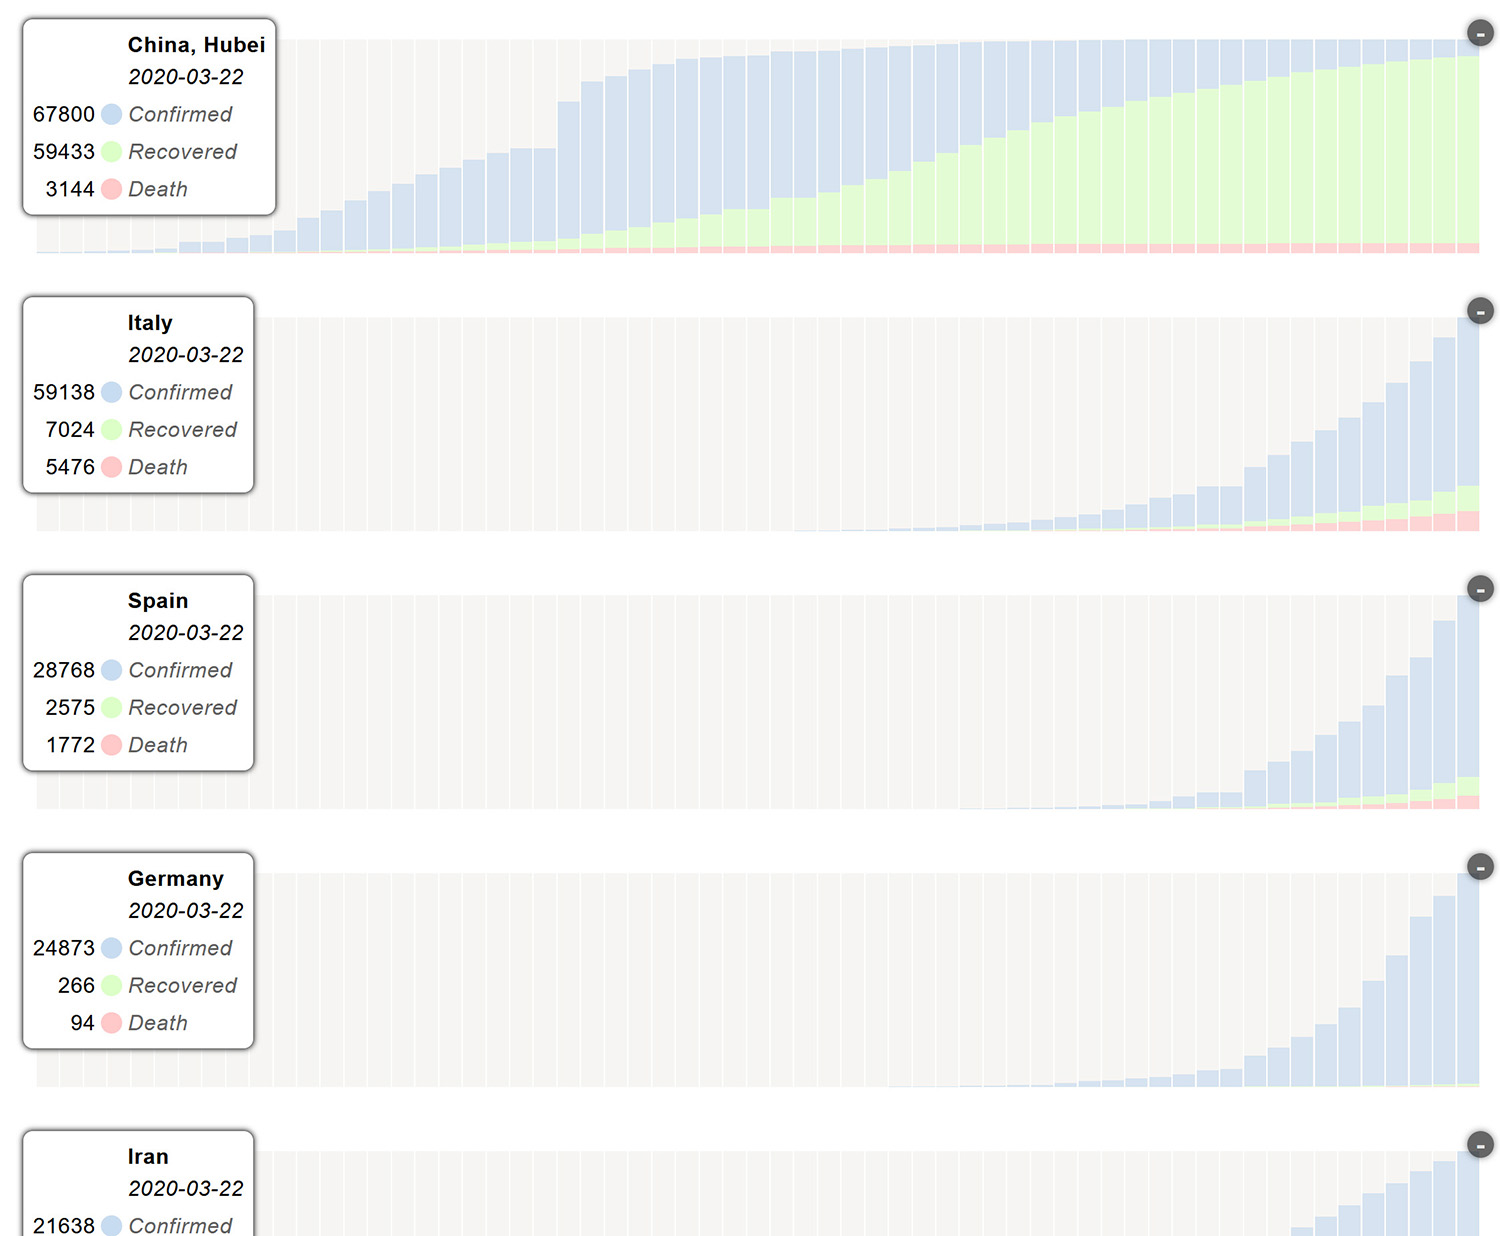
Corona Virus Navigator – update 2020-03-23
Although we are constantly updating and expanding our visualizations around the developments of the spread of the Corona virus, we are painfully aware of the underlying limitations and the risks of statistical communication.
-
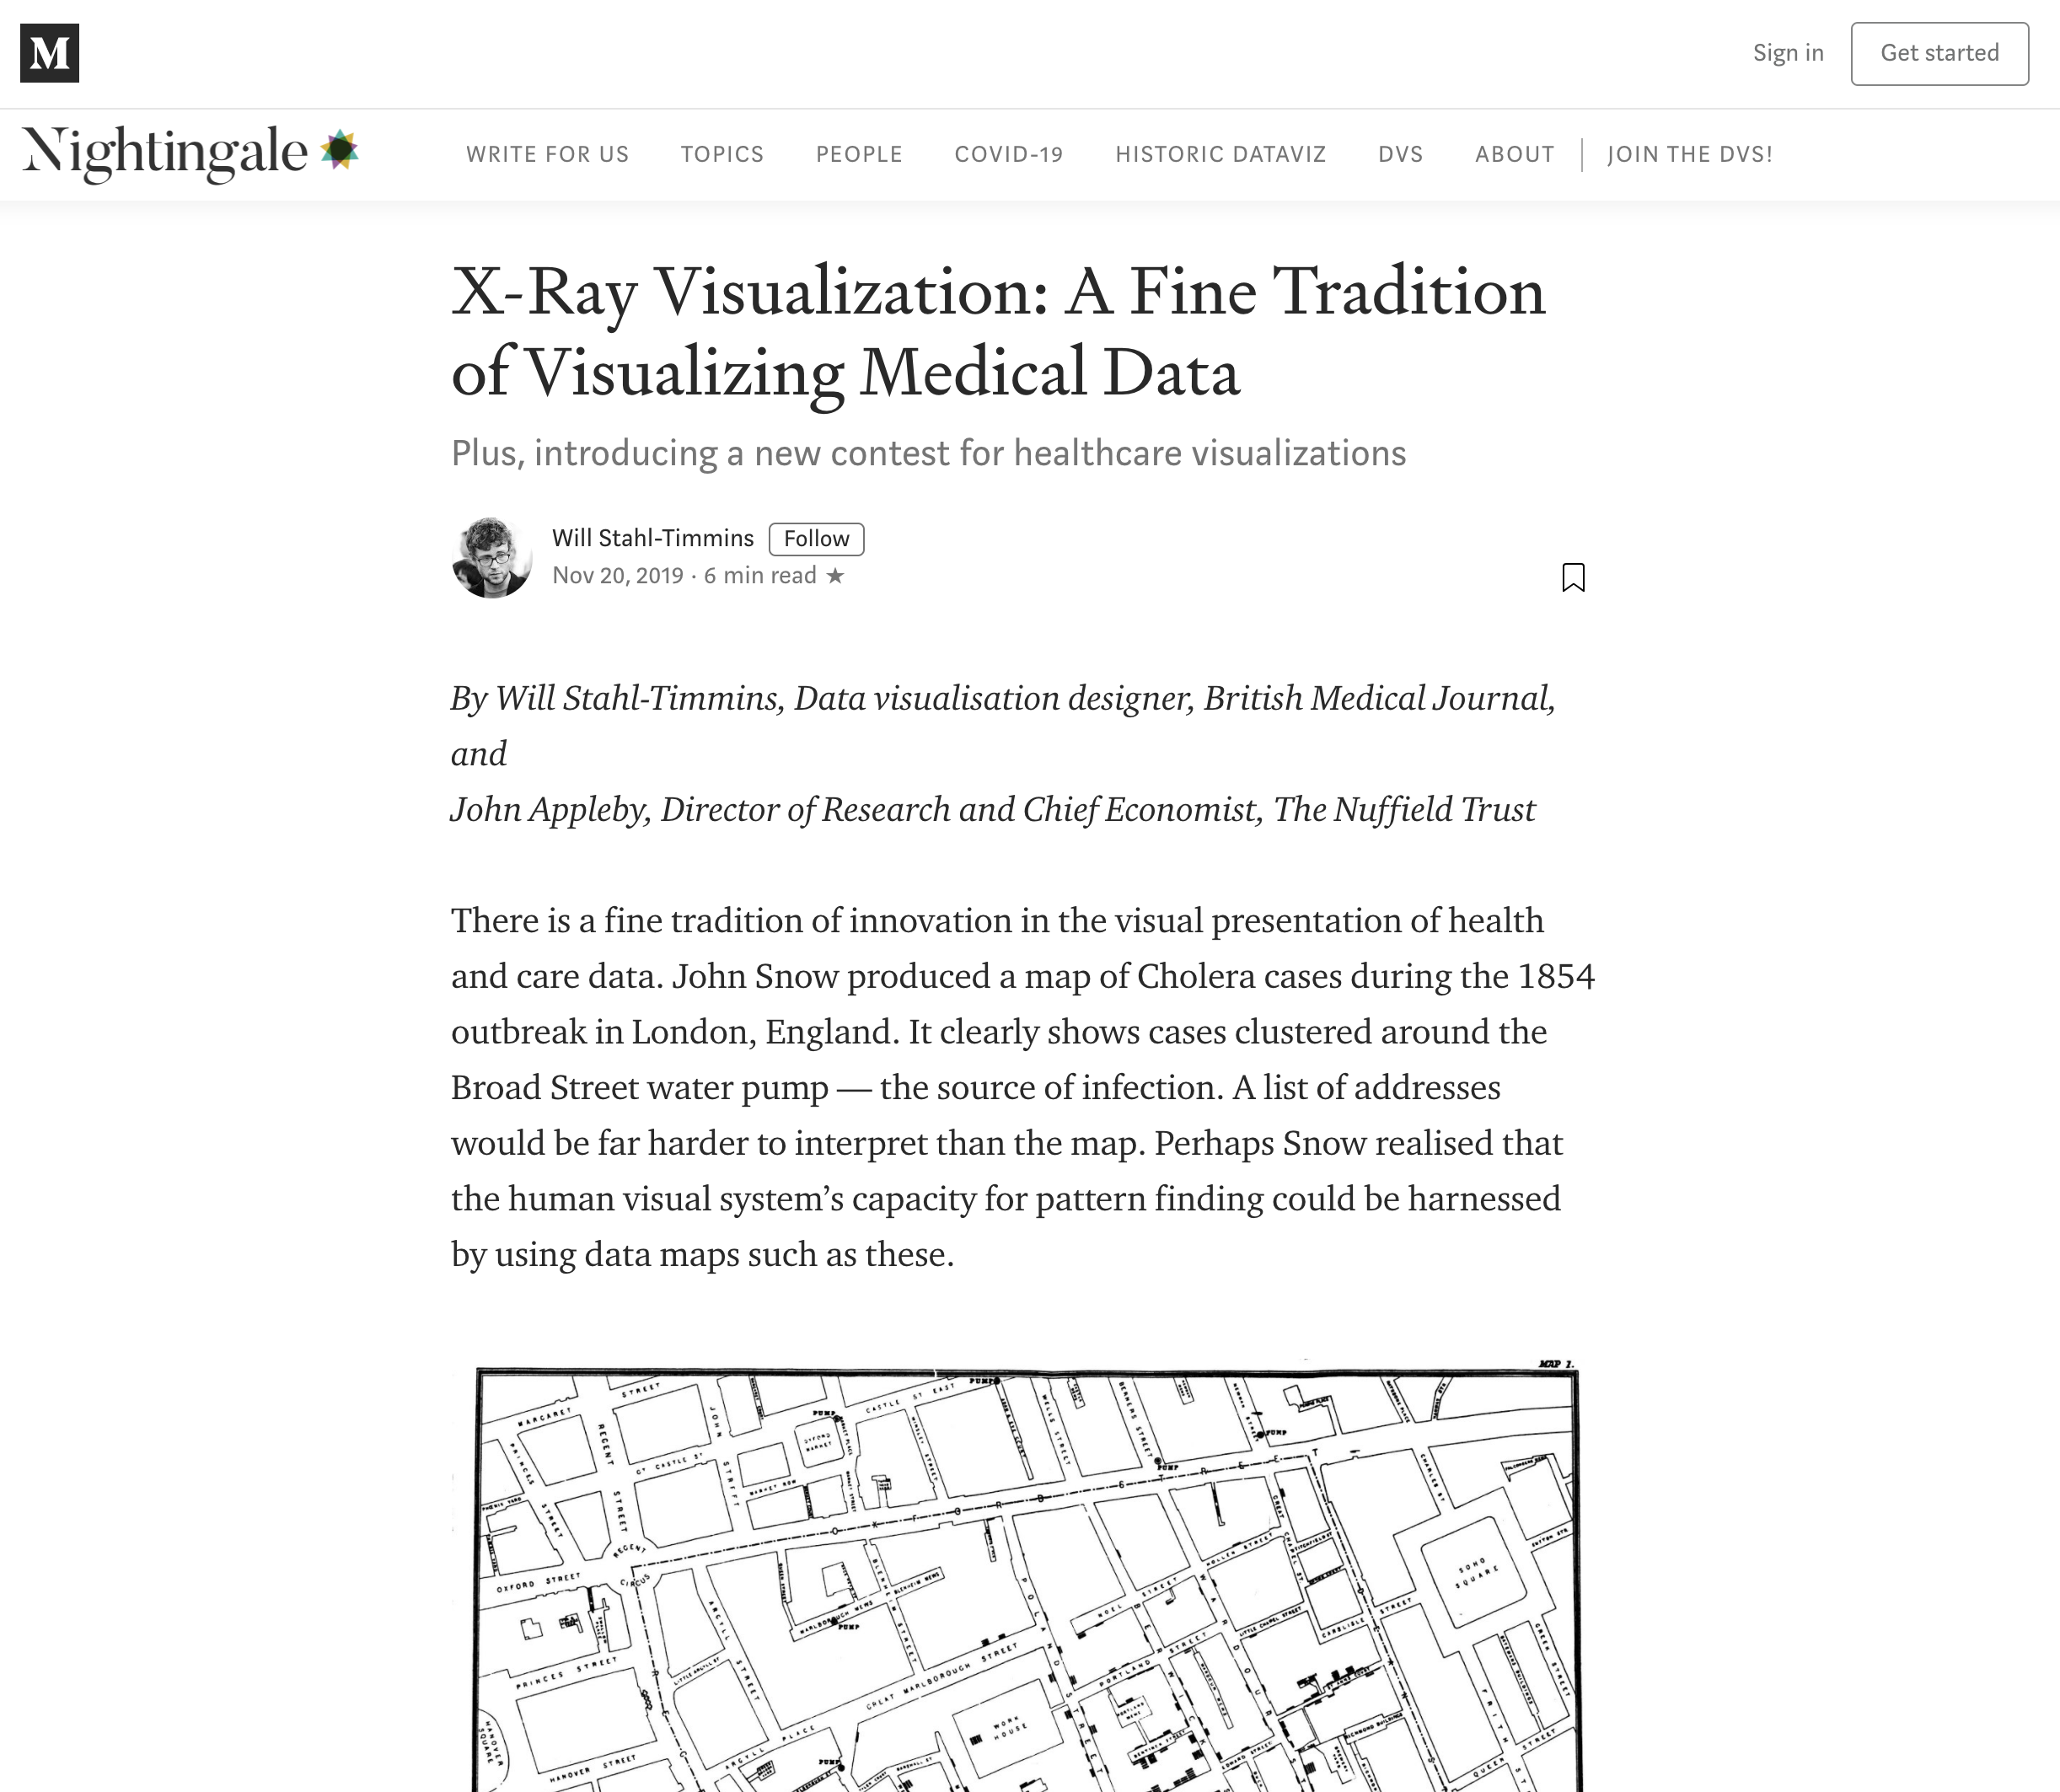
Nightingale, the journal of the Data Visualization Society
X-Ray Visualization: A Fine Tradition of Visualizing Medical Data – Plus, introducing a new contest for healthcare visualizations.
-
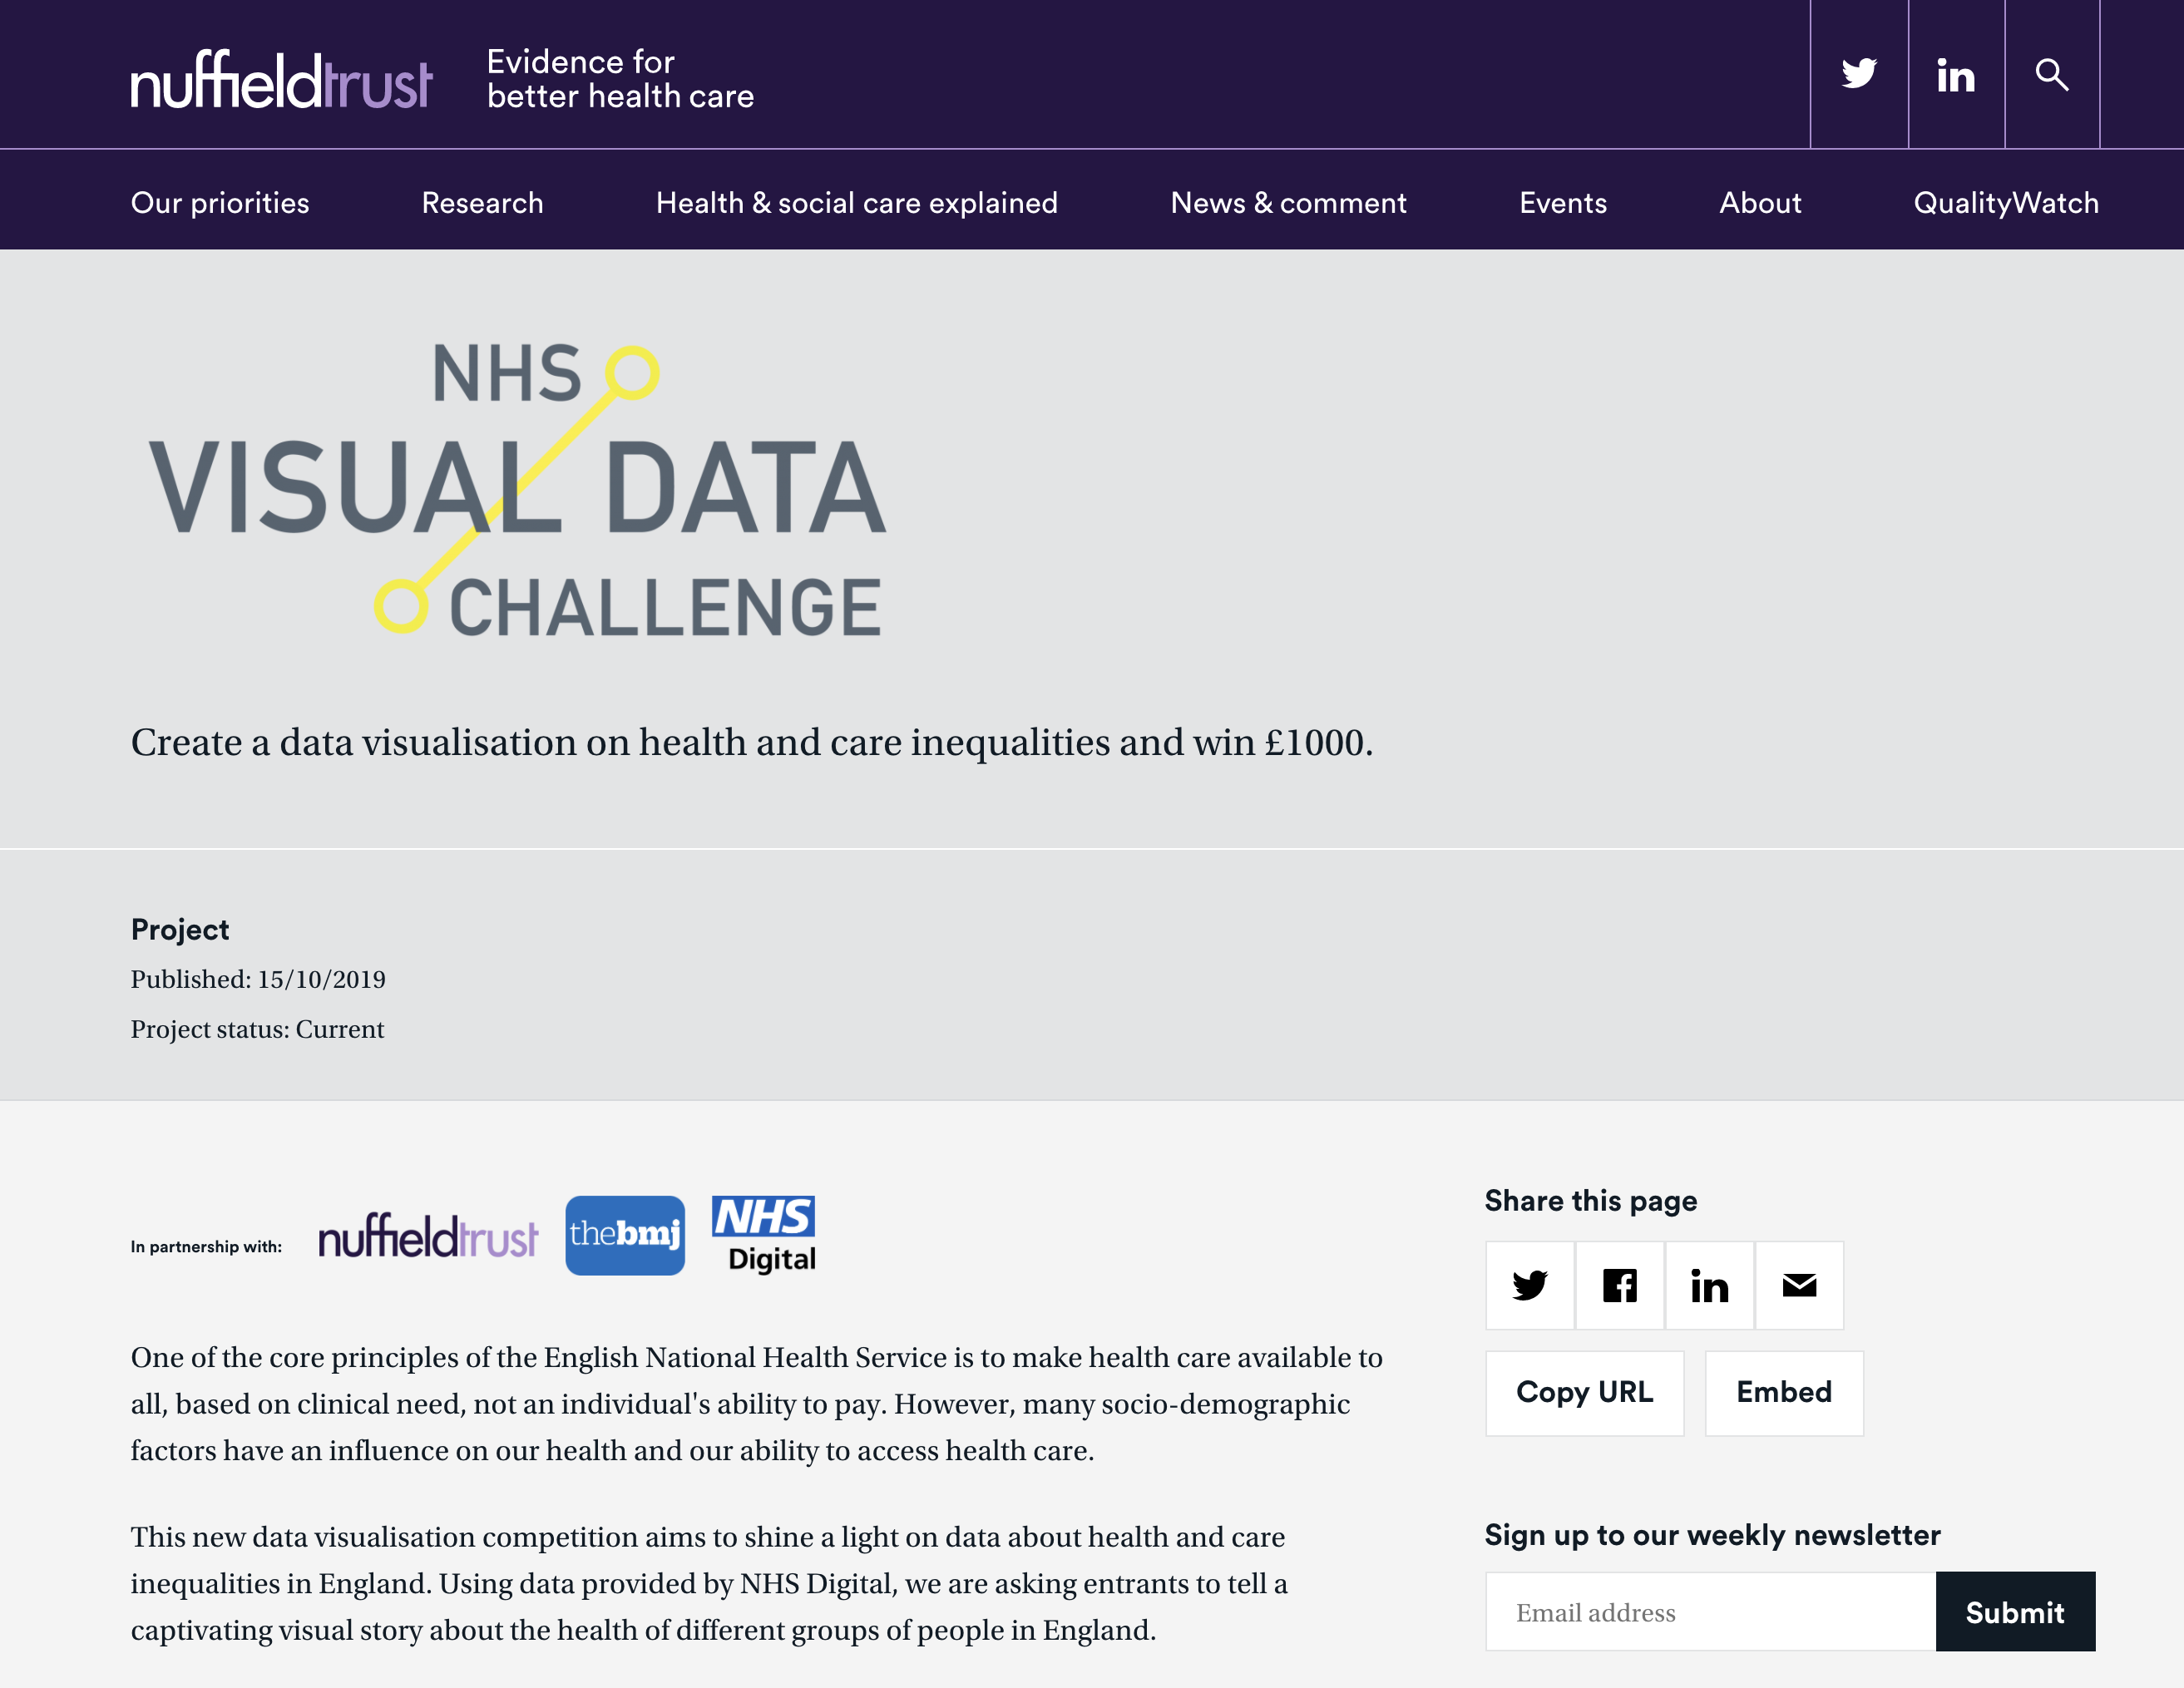
The BMJ (British Medical Journal)
Visualising health inequalities—Announcing a new data visualisation competition in healthcare. Given the ubiquity of data in our lives it is perhaps unsurprising that methods to help us understand this rising tide of digits have become increasingly popular.
-
COVID-19: numbers in context
Andreas Schneider from IIDj, Institute for Information Design Japan sent this article. Following the development of presentations around the coronavirus evolution we feel obliged to raise our concerns: Numbers are only meaningful if they refer to a known metric – the sum of the identified infections must be reported together with the total number of…
-

Visualizing Knowledge 2020 cancelled/postponed
Diploi, Kaleva Hall, Espoo This one-day conference VK20 questions how we can make democracy more visual, and thereby, enabling more people to be informed participants in democracy.
-

information+ conference 2020
September 24th-27th, 2020, Atlanta, Georgia, USA Interdisciplinary practices in information design & visualizationSeptember 24th-27th, 2020 at the Georgia Institute of Technology in Atlanta, Georgia (USA). Submission of abstracts: 20 April 2020